Generalized linear/additive model optimal design
Introduction
In vignette("lm_design"), the use of the lm_design
R6-class is
demonstrated to construct optimal designs for linear models. This
vignette introduces the glm_design and gam_design
R6-classes to
calculate approximate and exact optimal designs for generalized linear
and generalized additive models.
The methods available in the glm_design and gam_design classes are
identical to those of the lm_design class, and it is recommended to
read vignette("lm_design") before going through this vignette. The
principal difference between optimal experiment design for generalized
linear/additive models and linear models is that the information matrix
of a generalized linear model is usually not independent of the model
parameters , similar to the information matrix of a
nonlinear model, as explained in vignette("nlm_design").
GLM information matrix
Recall that a generalized linear model is defined by an error distribution family , a link function and a systematic (linear model) component , where is a -dimensional design vector and is the vector of model parameters of the same dimension. The error distribution family is assumed to be an exponential dispersion family, which means that the probability density (or mass) function of the distribution family can be written in canonical form as:
Here, is the cumulant generating function, such that and , where the latter is the variance function expressed as a function of the mean. The systematic component is linked to the mean through the link function :
Given the design matrix with rows , the information matrix, conditional on the dispersion parameter , is given by:
with weights capturing the heteroscedasticity of the error distribution family as:
For a normal error distribution with identity link, is constant, and we recover the usual information matrix of a linear model. In general, for a heteroscedastic distribution family or non-identity link function, depends on both the design point and the model parameters .
For this reason, glm_design and gam_design only calculate locally
optimal designs, conditional on a given vector of nominal parameter
values . This should not be confused with
Bayesian optimal design, where an expected optimality criterion is
calculated by integrating over a (prior) distribution assigned to the
parameters .
Remark: by default, an instance of class gam_design is initialized
using a normal error distribution with identity link function
(family = gaussian(link = "identity")). This means that, for this case
only, no nominal parameter values are needed,
since the information matrix reduces to that of a linear model.
Examples
Generalized linear models
Non-conforming tiles experiment
To demonstrate (locally) optimal design calculation with the
glm_design class, we consider two examples from (Lewis et al. 2001).
The first example, originally analyzed in (Taguchi and Y. 1980), is an
experiment involving tile manufacturing. The experiment measures
proportions of non-conforming tiles (per sample of 100 tiles) subject to
7 binary factors (x1 to x7). Following (Lewis et al. 2001, Example
3), the tile proportions are modeled using a GLM with a binomial
distribution, logit link function and main effects linear model for the
systematic component. This means that the mean tile proportions satisfy:
Based on data from an eight-run fractional factorial design, we obtain the initial parameter estimates by fitting the GLM.
Given the model formula, nominal parameter values
and a candidate design grid, the design object
can be initialized with glm_design$new():
library(cvxoptdes)

## design grid
data <- expand.grid(
  x1 = c(-1, 1),
  x2 = c(-1, 1),
  x3 = c(-1, 1),
  x4 = c(-1, 1),
  x5 = c(-1, 1),
  x6 = c(-1, 1),
  x7 = c(-1, 1)
)

design <- glm_design$new(
  formula = ~x1 + x2 + x3 + x4 + x5 + x6 + x7,     ## systematic component
  data = data,
  family = binomial(link = "logit"),
  theta = c(-1.419, -0.578, 0.109, 0.266, -0.262, 0.434, -0.633, 0.425)
)
After initializing the generalized linear model and candidate design
grid, we use the $optimize() method to calculate an approximate
(locally) D-optimal design:
## approximate optimal design
design$optimize(criterion = "D") |> round(2)
#>   [1] 0.00 0.00 0.04 0.00 0.02 0.00 0.00 0.00 0.00 0.00 0.00 0.00 0.00 0.00 0.04 0.00 0.00 0.00 0.00 0.00 0.01 0.06 0.05 0.00 0.06 0.00 0.02 0.00 0.00
#>  [30] 0.00 0.00 0.00 0.00 0.00 0.00 0.00 0.00 0.00 0.00 0.00 0.00 0.00 0.00 0.00 0.00 0.00 0.00 0.00 0.00 0.00 0.00 0.00 0.00 0.00 0.05 0.00 0.00 0.00
#>  [59] 0.00 0.00 0.00 0.00 0.00 0.00 0.04 0.00 0.00 0.00 0.02 0.01 0.00 0.04 0.00 0.00 0.03 0.00 0.04 0.00 0.00 0.00 0.00 0.04 0.04 0.02 0.05 0.00 0.00
#>  [88] 0.00 0.00 0.00 0.00 0.03 0.00 0.01 0.04 0.05 0.00 0.00 0.00 0.00 0.00 0.00 0.05 0.00 0.00 0.00 0.00 0.00 0.00 0.00 0.00 0.00 0.04 0.00 0.03 0.00
#> [117] 0.00 0.00 0.00 0.02 0.00 0.00 0.01 0.00 0.07 0.00 0.00 0.00
#> attr(,"criterion")
#> attr(,"criterion")$crit.value
#> [1] 0.1852777
#>
#> attr(,"criterion")$crit
#> [1] "D"
To round the approximate D-optimal design to an exact (integer) design
with a given number of observations, we proceed in the same way as in
vignette("lm_design") using the $round() method:
## integer design w/ 8 design points
(exact_design <- design$round(m = 8, method = "optimal", seed = 1, n_repeats = 25))
#>   [1] 0 0 0 0 0 0 0 0 0 0 0 0 0 0 1 0 0 0 0 0 0 1 0 0 0 0 0 0 0 0 0 0 0 0 0 0 0 0 0 0 0 0 0 0 0 0 0 0 0 0 1 0 0 0 0 0 0 0 0 0 0 0 0 0 1 0 0 0 0 0 0 0
#>  [73] 0 0 0 0 0 0 0 0 0 0 0 0 0 0 1 0 0 0 0 1 0 0 0 0 0 0 0 0 0 0 0 1 0 0 0 0 0 0 0 0 0 0 0 0 0 0 0 0 0 0 0 0 1 0 0 0
#> attr(,"criterion")
#> attr(,"criterion")$crit
#> [1] "D"
#>
#> attr(,"criterion")$crit.value
#> [1] 0.1706436
#>
#> attr(,"criterion")$crit.rel.eff
#> [1] 0.9210156

design$subset(replicates = exact_design)
#>     x1 x2 x3 x4 x5 x6 x7
#> 15  -1  1  1  1 -1 -1 -1
#> 22   1 -1  1 -1  1 -1 -1
#> 51  -1  1 -1 -1  1  1 -1
#> 65  -1 -1 -1 -1 -1 -1  1
#> 87  -1  1  1 -1  1 -1  1
#> 92   1  1 -1  1  1 -1  1
#> 104  1  1  1 -1 -1  1  1
#> 125 -1 -1  1  1  1  1  1
All other methods available for objects of class lm_design can also be
used for glm_design objects (e.g. $stratify(), $augment(),
$vcov(), etc.). For comparison, we can evaluate the D-criterion of the
original fractional factorial design:
## fractional factorial design w/ 8 design points
init_design <- c(0, 0, 0, 0, 0, 0, 0, 1, 0, 0, 0, 0, 0, 0, 0, 0, 0, 0, 0, 0,
                 0, 0, 0, 0, 0, 1, 0, 0, 0, 0, 0, 0, 0, 0, 0, 0, 0, 0, 0, 0, 0,
                 0, 1, 0, 0, 0, 0, 0, 0, 0, 0, 0, 1, 0, 0, 0, 0, 0, 0, 0, 0, 0,
                 0, 0, 0, 0, 0, 0, 0, 0, 0, 0, 0, 0, 0, 0, 1, 0, 0, 0, 0, 0, 1,
                 0, 0, 0, 0, 0, 0, 0, 0, 0, 0, 0, 0, 0, 0, 1, 0, 0, 0, 0, 0, 0,
                 0, 0, 0, 0, 0, 0, 0, 0, 0, 0, 0, 0, 0, 0, 0, 0, 0, 0, 0, 0, 0,
                 0, 0, 1)

design$subset(replicates = init_design)
#>     x1 x2 x3 x4 x5 x6 x7
#> 8    1  1  1 -1 -1 -1 -1
#> 26   1 -1 -1  1  1 -1 -1
#> 43  -1  1 -1  1 -1  1 -1
#> 53  -1 -1  1 -1  1  1 -1
#> 77  -1 -1  1  1 -1 -1  1
#> 83  -1  1 -1 -1  1 -1  1
#> 98   1 -1 -1 -1 -1  1  1
#> 128  1  1  1  1  1  1  1

## D-criterion
design$crit(init_design, criterion = "D")
#> [1] 0.126333
In terms of the ratio of D-criteria, the locally D-optimal design is 35% more efficient compared to the fractional factorial design reported in (Lewis et al. 2001), but this is expected, since the optimality criterion is evaluated conditional on the nominal parameter values , whereas the fractional factorial design was constructed independent of the parameter values.
Defect semiconductor wafers
The second example is an experiment counting defects on wafers in a
semiconductor manufacturing process (Lewis et al. 2001, Example 5). The
counts are modeled using a GLM with a Poisson distribution and log-link
function. The systematic component consists of a full quadratic model in
terms of three continuous factors x1, x2 and x3.
An initial 18-run central composite design is reported in (Lewis et al. 2001), where the factors are evaluated across 5 scaled levels: , which results in the parameter estimates .
Given the model formula, nominal parameter values , and the candidate design grid, we calculate a locally D-optimal design of size . Similar to the central composite design, we constrain the candidate design grid so that the extremes can only occur in combination with zeros for the remaining factors. To accomplish this, we include only the allowed design points in the candidate design grid:
## candidate grid
data <- rbind(
  expand.grid(x1 = -1:1, x2 = -1:1, x3 = -1:1),
  data.frame(
    x1 = c(-1.732, 1.732, 0, 0, 0, 0),
    x2 = c(0, 0, -1.732, 1.732, 0, 0),
    x3 = c(0, 0, 0, 0, -1.732, 1.732)
  )
)

design <- glm_design$new(
  formula = ~(x1 + x2 + x3)^2 + I(x1^2) + I(x2^2) + I(x3^2),
  data = data,
  family = poisson(link = "log"),
  theta = c(1.9293, 0.6103, 0.7028, -0.3531, 0, 0.2471, 0, -0.5209, 0, 0)
)

## approximate D-optimal design
design$optimize(criterion = "D") |> round(2)
#>  [1] 0.00 0.00 0.09 0.00 0.00 0.00 0.09 0.00 0.09 0.00 0.00 0.00 0.00 0.00 0.00 0.00 0.10 0.00 0.00 0.00 0.10 0.00 0.00 0.00 0.10 0.00 0.09 0.02 0.08
#> [30] 0.09 0.09 0.06 0.00
#> attr(,"criterion")
#> attr(,"criterion")$crit.value
#> [1] 8.212709
#>
#> attr(,"criterion")$crit
#> [1] "D"

## integer design w/ 18 design points
(exact_design <- design$round(m = 18, method = "optimal", seed = 1))
#>  [1] 0 0 1 0 0 0 2 0 2 0 0 0 0 0 0 0 2 0 0 0 2 0 0 0 2 0 1 0 1 2 2 1 0
#> attr(,"criterion")
#> attr(,"criterion")$crit
#> [1] "D"
#>
#> attr(,"criterion")$crit.value
#> [1] 7.984934
#>
#> attr(,"criterion")$crit.rel.eff
#> [1] 0.9722655

design$subset(replicates = exact_design)
#>          x1     x2     x3
#> 3     1.000 -1.000 -1.000
#> 7    -1.000  1.000 -1.000
#> 7.1  -1.000  1.000 -1.000
#> 9     1.000  1.000 -1.000
#> 9.1   1.000  1.000 -1.000
#> 17    0.000  1.000  0.000
#> 17.1  0.000  1.000  0.000
#> 21    1.000 -1.000  1.000
#> 21.1  1.000 -1.000  1.000
#> 25   -1.000  1.000  1.000
#> 25.1 -1.000  1.000  1.000
#> 27    1.000  1.000  1.000
#> 29    1.732  0.000  0.000
#> 30    0.000 -1.732  0.000
#> 30.1  0.000 -1.732  0.000
#> 31    0.000  1.732  0.000
#> 31.1  0.000  1.732  0.000
#> 32    0.000  0.000 -1.732
The locally D-optimal design is 15% more efficient than the central composite design in terms of the ratio of D-criteria. Again, this is not surprising as the D-optimal design was generated conditional on the nominal parameter values . Note that a D-optimal design based on the systematic component viewed as a linear model is only 4.3% more efficient than the central composite design.
## central composite design w/ 18 design points
init_design <- c(1, 0, 1, 0, 0, 0, 1, 0, 1, 0, 0, 0, 0, 4, 0, 0, 0, 0, 1, 0, 1, 0, 0, 0, 1, 0, 1, 1, 1, 1, 1, 1, 1)
design$subset(replicates = init_design)
#>          x1     x2     x3
#> 1    -1.000 -1.000 -1.000
#> 3     1.000 -1.000 -1.000
#> 7    -1.000  1.000 -1.000
#> 9     1.000  1.000 -1.000
#> 14    0.000  0.000  0.000
#> 14.1  0.000  0.000  0.000
#> 14.2  0.000  0.000  0.000
#> 14.3  0.000  0.000  0.000
#> 19   -1.000 -1.000  1.000
#> 21    1.000 -1.000  1.000
#> 25   -1.000  1.000  1.000
#> 27    1.000  1.000  1.000
#> 28   -1.732  0.000  0.000
#> 29    1.732  0.000  0.000
#> 30    0.000 -1.732  0.000
#> 31    0.000  1.732  0.000
#> 32    0.000  0.000 -1.732
#> 33    0.000  0.000  1.732

## D-criterion
design$crit(init_design, criterion = "D")
#> [1] 6.939439
Generalized additive models
The glm_design class accepts only linear model formulas for the
systematic component of the GLM. With the
gam_design class, a GAM formula including smooth terms s, te, ti
and t2 using
mgcv
formula syntax can be specified for the systematic component of the
model. By default, a Gaussian error distribution with identity link
function is assumed for the generalized additive model
(family = gaussian()), in which case the information matrix is
independent of the model parameters. If a different error distribution
family is specified, then a nominal set of parameter values (theta)
must be provided as well, analogous to the glm_design class.
Ethanol dataset
To illustrate optimal design calculation for generalized additive models
with the gam_design class, we load the ethanol dataset (Ruppert et
al. 2003). This dataset reports measurements from an experiment in which
ethanol was burned in a single cylinder automobile test engine. There
are two continuous predictors: the compression ratio of the engine
(C), and the equivalence ratio at which the engine was run (E). The
response variable is the concentration of nitric oxide (NO) and nitrogen
dioxide (NO2) in engine exhaust (NOx). As a model for the NOx
response, we consider a simple GAM consisting of a smooth term (s(E))
modeling the effect of the equivalence ratio and a linear effect for the
compression ratio (C). The errors are assumed to be homoscedastic and
normally distributed, so no nominal parameter values theta need to be
specified.
## initialize model
design <- gam_design$new(
  formula = ~s(E) + C,
  data = ethanol
)

design$data
#>      NOx    C     E
#> 1  3.741 12.0 0.907
#> 2  2.295 12.0 0.761
#> 3  1.498 12.0 1.108
#> 4  2.881 12.0 1.016
#> 5  0.760 12.0 1.189
#> 6  3.120  9.0 1.001
#> 7  0.638  9.0 1.231
#> 8  1.170  9.0 1.123
#> 9  2.358 12.0 1.042
#> 10 0.606 12.0 1.215
....
After initialization of the gam_design object, we compute an I-optimal
design in the same way as for an object of class glm_design. The
smooth term s(E) has basis functions (and 10 coefficients),
which means that the exact I-optimal design requires at least
design points for a non-singular information matrix and non-zero
optimality criterion.
## approximate optimal design
design$optimize(criterion = "I") |> round(2)
#>  [1] 0.00 0.00 0.00 0.00 0.00 0.00 0.04 0.00 0.00 0.00 0.00 0.00 0.00 0.03 0.02 0.00 0.00 0.00 0.04 0.00 0.00 0.06 0.00 0.00 0.03 0.00 0.00 0.00 0.00
#> [30] 0.00 0.00 0.00 0.00 0.00 0.00 0.04 0.00 0.04 0.00 0.04 0.00 0.05 0.03 0.00 0.00 0.00 0.00 0.00 0.00 0.05 0.03 0.00 0.00 0.00 0.01 0.08 0.00 0.04
#> [59] 0.00 0.07 0.05 0.00 0.00 0.06 0.05 0.00 0.00 0.00 0.00 0.00 0.00 0.00 0.00 0.00 0.00 0.00 0.00 0.00 0.00 0.00 0.05 0.00 0.00 0.05 0.00 0.00 0.04
#> [88] 0.00
#> attr(,"criterion")
#> attr(,"criterion")$crit.value
#> [1] 0.1028902
#>
#> attr(,"criterion")$crit
#> [1] "I"

## integer design w/ 11 design points
(exact_design <- design$round(m = 11, method = "optimal", criterion = "I", seed = 1))
#>  [1] 0 0 0 0 0 0 0 0 0 0 0 0 0 0 0 0 0 0 0 0 0 0 0 0 0 0 0 0 0 0 0 0 1 0 0 0 0 0 0 1 0 1 0 0 0 0 0 0 0 0 0 0 0 0 0 1 0 0 0 1 1 0 0 0 0 0 0 0 0 0 0 0 0
#> [74] 1 0 0 1 0 0 0 1 0 0 1 0 0 1 0
#> attr(,"criterion")
#> attr(,"criterion")$crit
#> [1] "I"
#>
#> attr(,"criterion")$crit.value
#> [1] 0.09616473
#>
#> attr(,"criterion")$crit.rel.eff
#> [1] 0.9346341
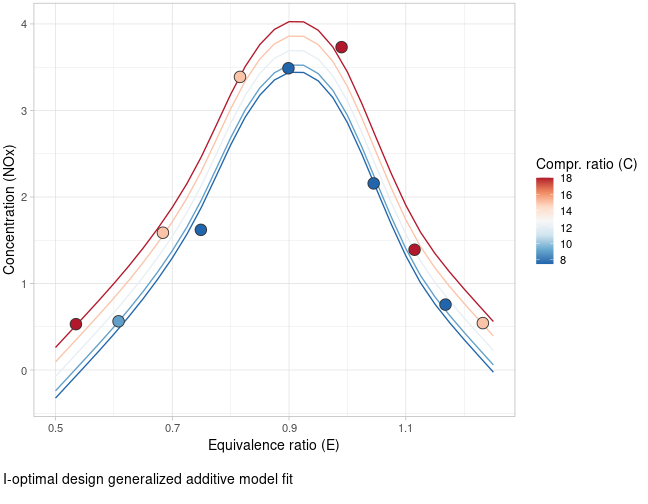
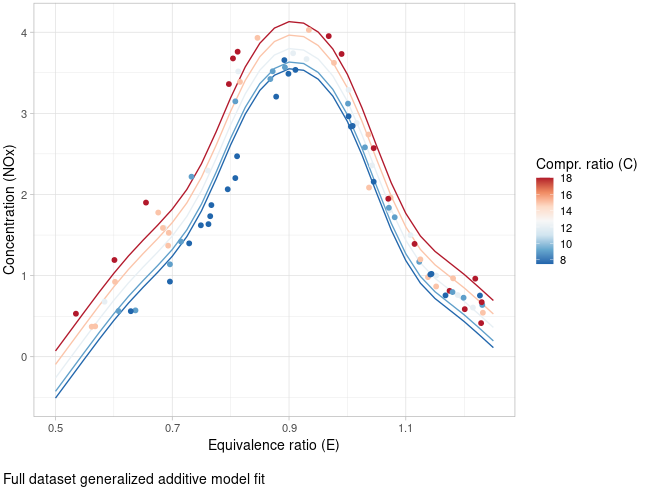
The first figure below displays the selected design points in the
calculated I-optimal design, as well as the predicted NOx
concentrations based on the GAM fitted to the design of size . To
compare, the second figure displays the same GAM fitted to the full
dataset of size .
Volcano height dataset
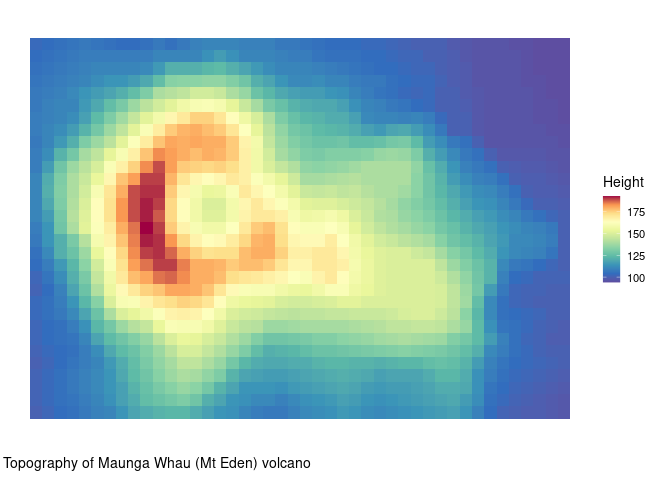
As a second example, we load the volcano dataset, which contains
topographic information of the Maunga Whau (Mt Eden) volcano in the
Auckland volcano field. To reduce computational effort, we first
downsample the volcano data, resulting in volcano heights across a
-dimensional matrix with rows corresponding to grid
lines running east to west and columns to grid lines running south to
north.
## initialize data
data(volcano)

volcano <- volcano[c(TRUE, FALSE), c(TRUE, FALSE)]

data <- expand.grid(
  x1 = seq_len(dim(volcano)[1]),
  x2 = seq_len(dim(volcano)[2])
)
data[["y"]] <- c(volcano)
To capture the smoothly varying volcano height, we consider a general
two-dimensional (isotropic) smooth ~s(x1, x2) with a total of
basis functions. Given the model and 2D data grid, we calculate an
I-optimal design of size . Note that we skip the optimization of
the approximate design and directly run 100 repeats of the
point-exchange procedure in parallel with mirai. Setting
design_weights = FALSE, the integer designs used as starting points
for the point-exchange are initialized by random sampling.
## initialize model
design <- gam_design$new(
  formula = ~s(x1, x2),
  data = data
)

## parallel evaluation
mirai::daemons(n = parallel::detectCores() / 2, seed = 1)

exact_design <- design$round(m = 30, method = "optimal", criterion = "I", n_repeats = 100, design_weights = FALSE)

mirai::daemons(0)

design$crit(exact_design, criterion = "I")
#> [1] 0.0341186
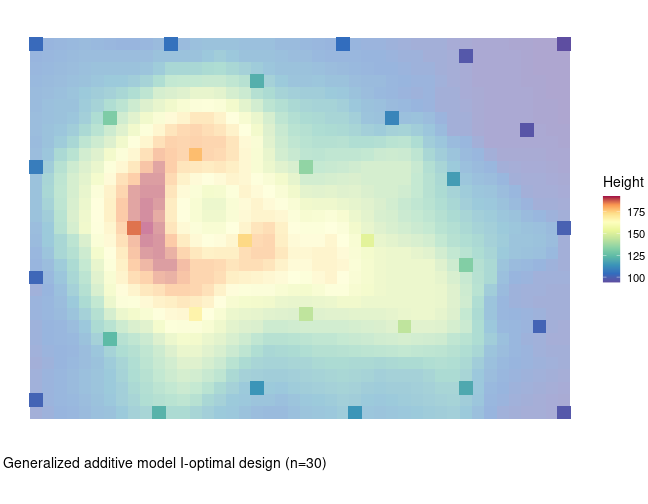
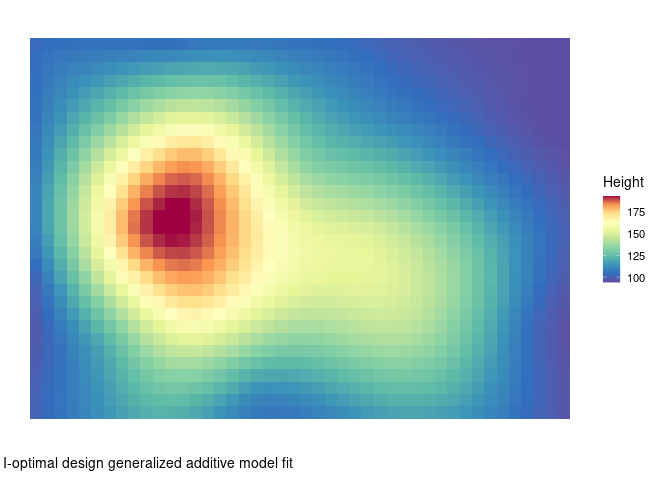
The resulting I-optimal design is a type of space-filling design as
shown in the figure below, which makes sense as the accuracy of the GAM
regression splines increases with design points that are evenly spread
across the 2D grid. The second figure displays the predicted volcano
height based on the GAM fitted to the selected design points in the
I-optimal design. A rough outline of the volcano is present in the GAM
predicted surface, but the more detailed volcano ridges are not yet
visible. To achieve more accuracy in predicting the volcano ridges, we
can construct a second (optimization) design focused on the area where
the volcano height is high. This approach is discussed in more detail in
vignette("augment_design").
References
Lewis, S. L., Montgomery D. C., and Myers R. H. 2001. “Examples of Designed Experiments with Nonnormal Responses.” Journal of Quality Technology 3 (33): 265–78. https://doi.org/10.1080/00224065.2001.11980078.
Ruppert, D., M. P. Wand, and R. J. Carroll. 2003. Semiparametric Regression. Cambridge university press.
Taguchi, G., and Wu Y. 1980. Introduction to Off-Line Quality Control.